
Dashboard and
Self-Service Data Visualization
B2B, SaaS, Data Analytics, Startup, 0-1
Berlin, Germany, Jun 2023 – Feb 2025
Overview
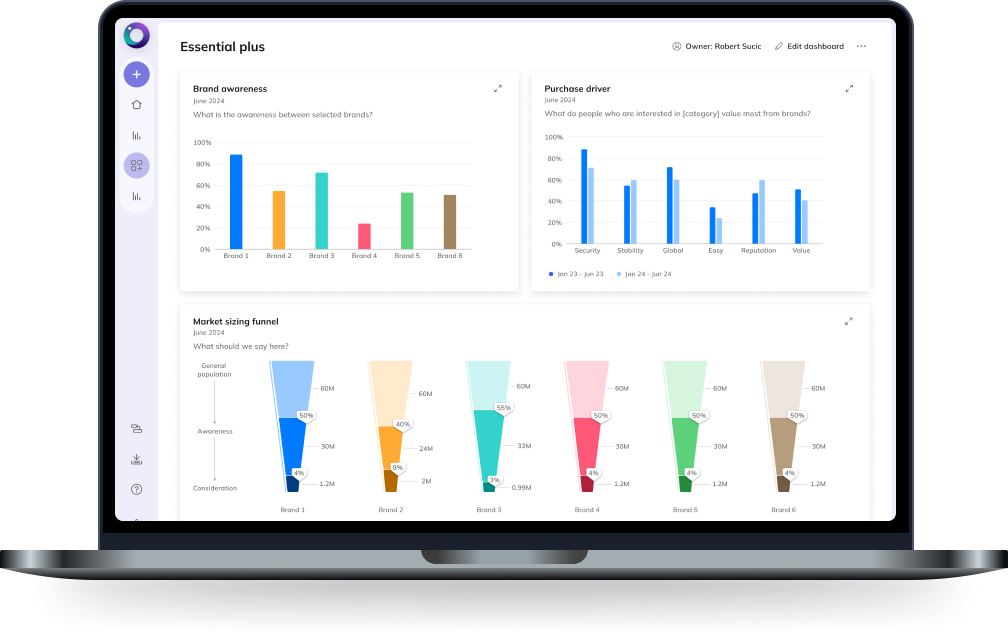
Latana, a Berlin-based startup, offers AI-powered brand tracking. As Lead Product Designer, I led the design of its first user-facing dashboard, turning raw data into actionable insights for brand managers and marketers.
🤔 Problem
Users struggled to extract insights from complex CSV and spreadsheet data. Manual analysis was slow, error-prone, and lacked real-time flexibility.
🕴 My Role
I owned the end-to-end design process, collaborating with PM, data scientists, engineers, and customer relations to deliver a scalable, user-friendly solution.
💡 Solution
Delivered in three key phases:
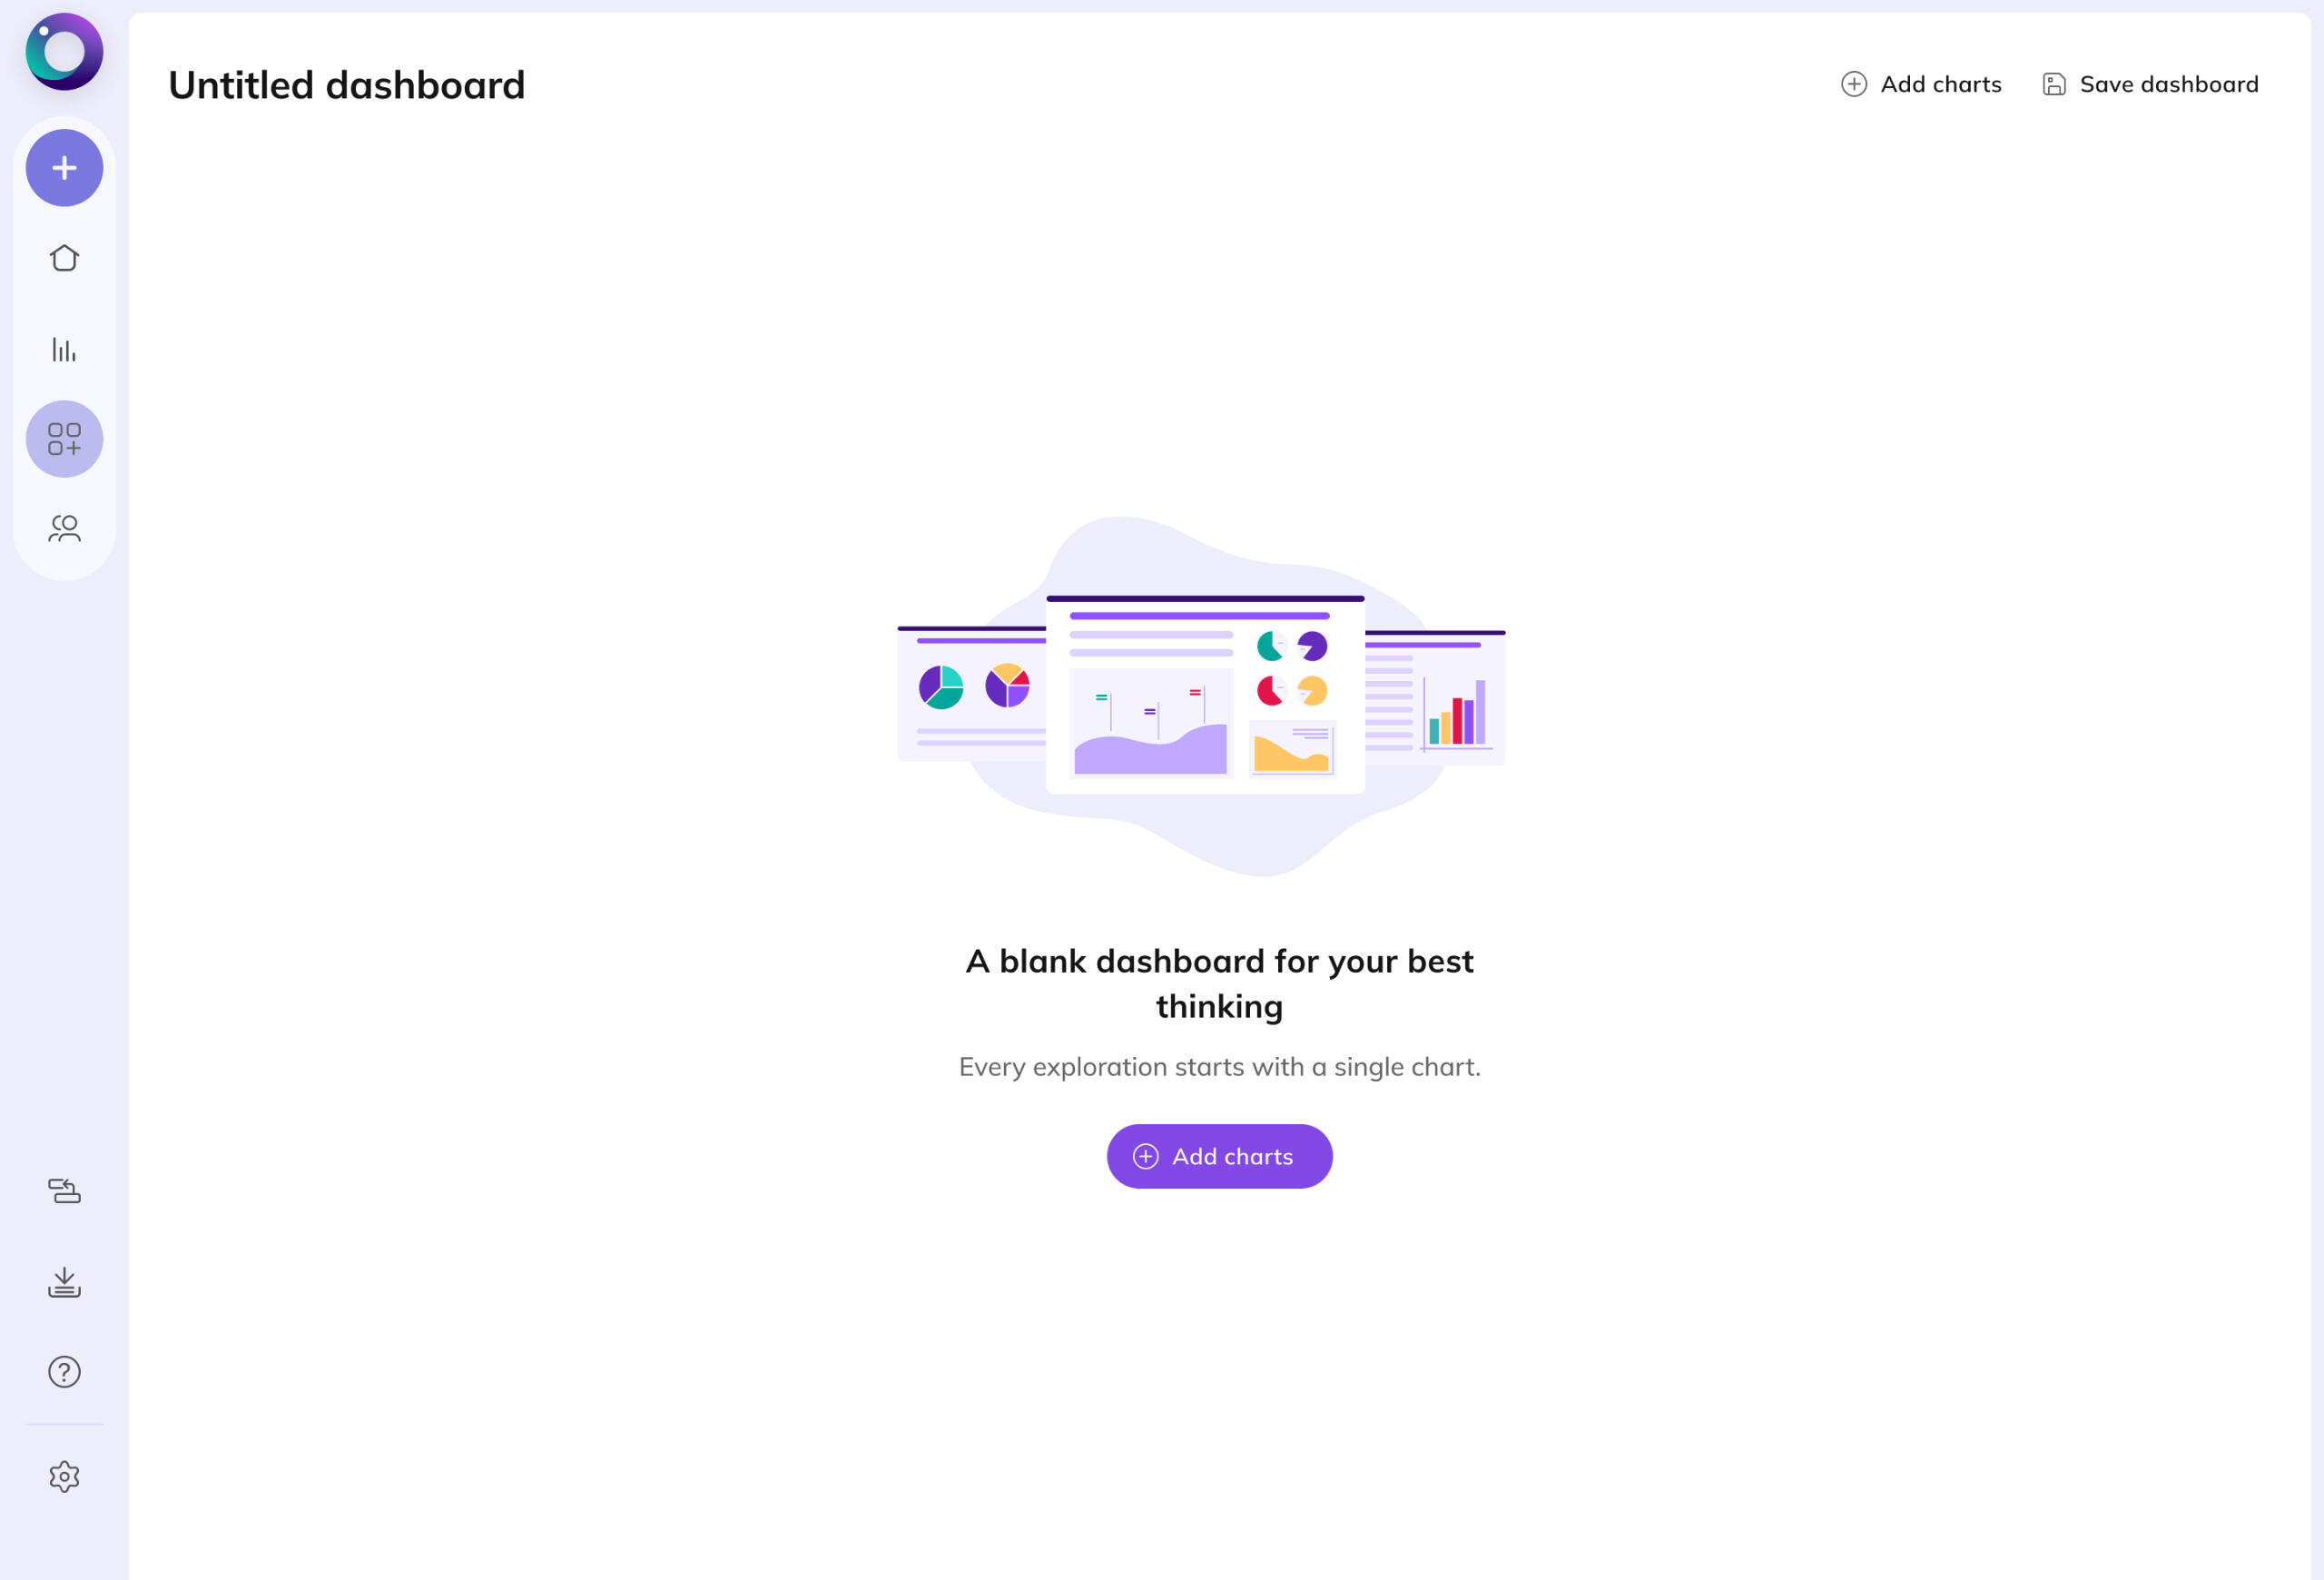
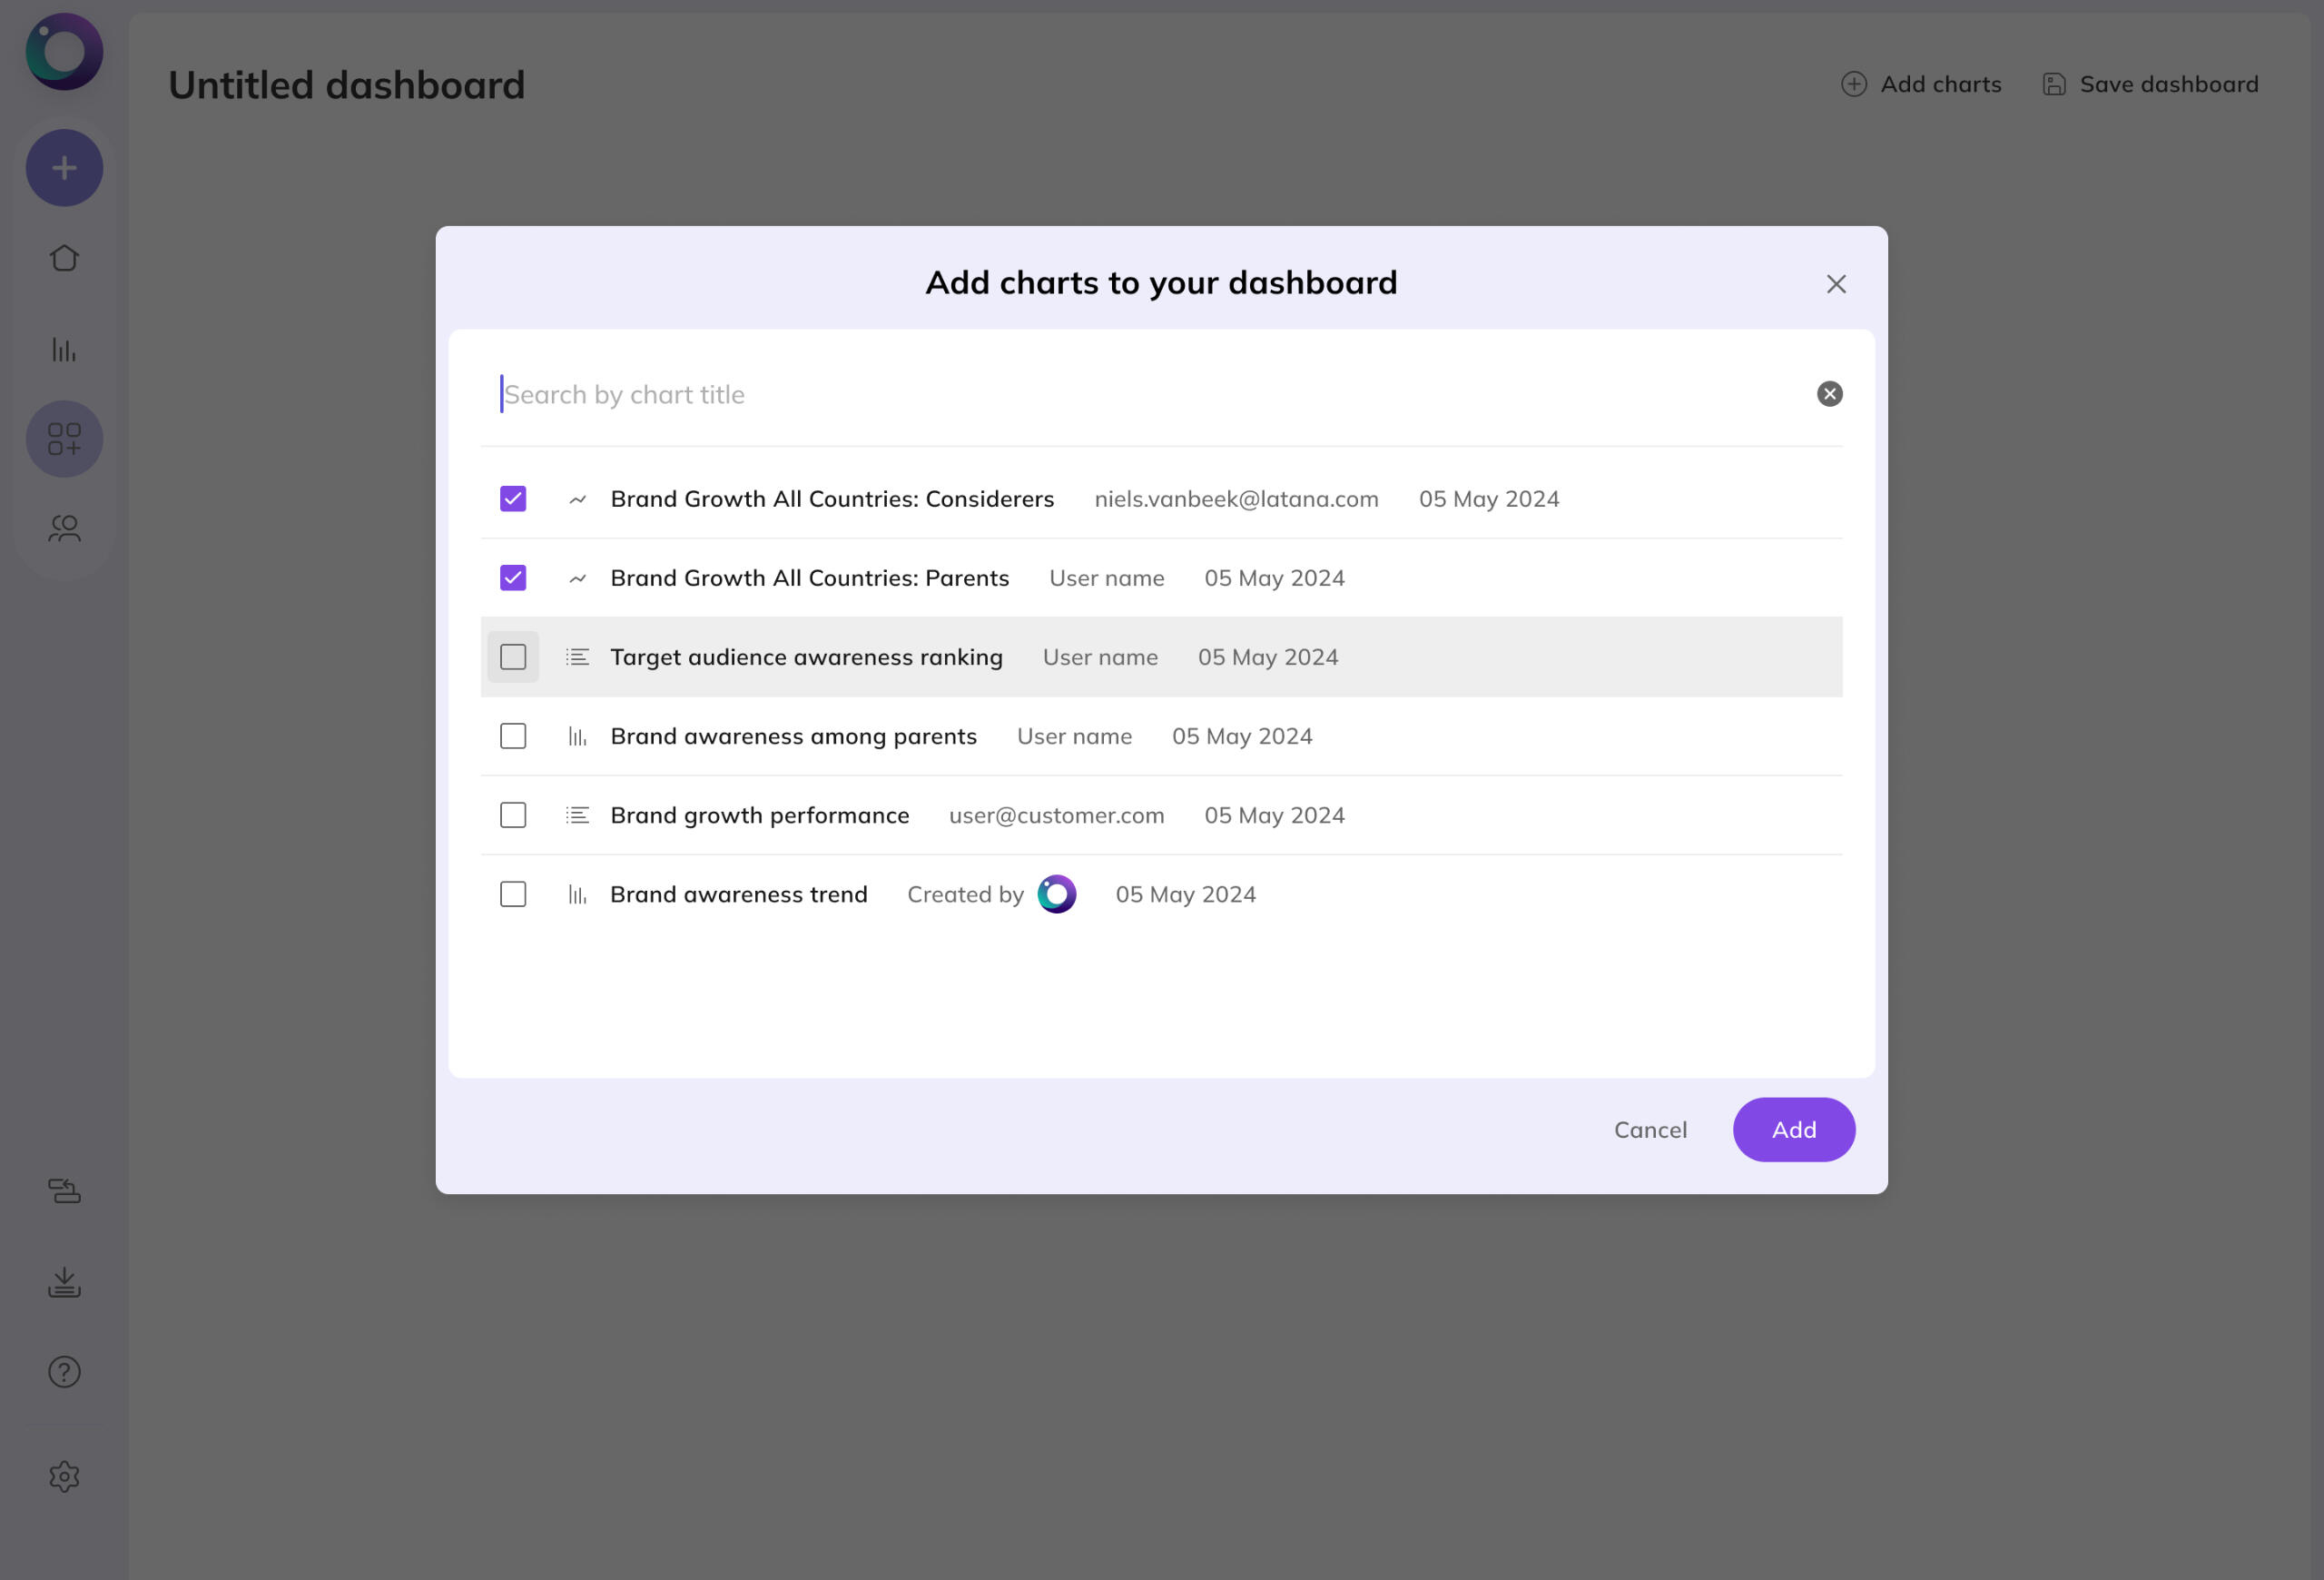
1. Dashboard CRUD:
Designed core features for creating, updating, and managing dashboards.
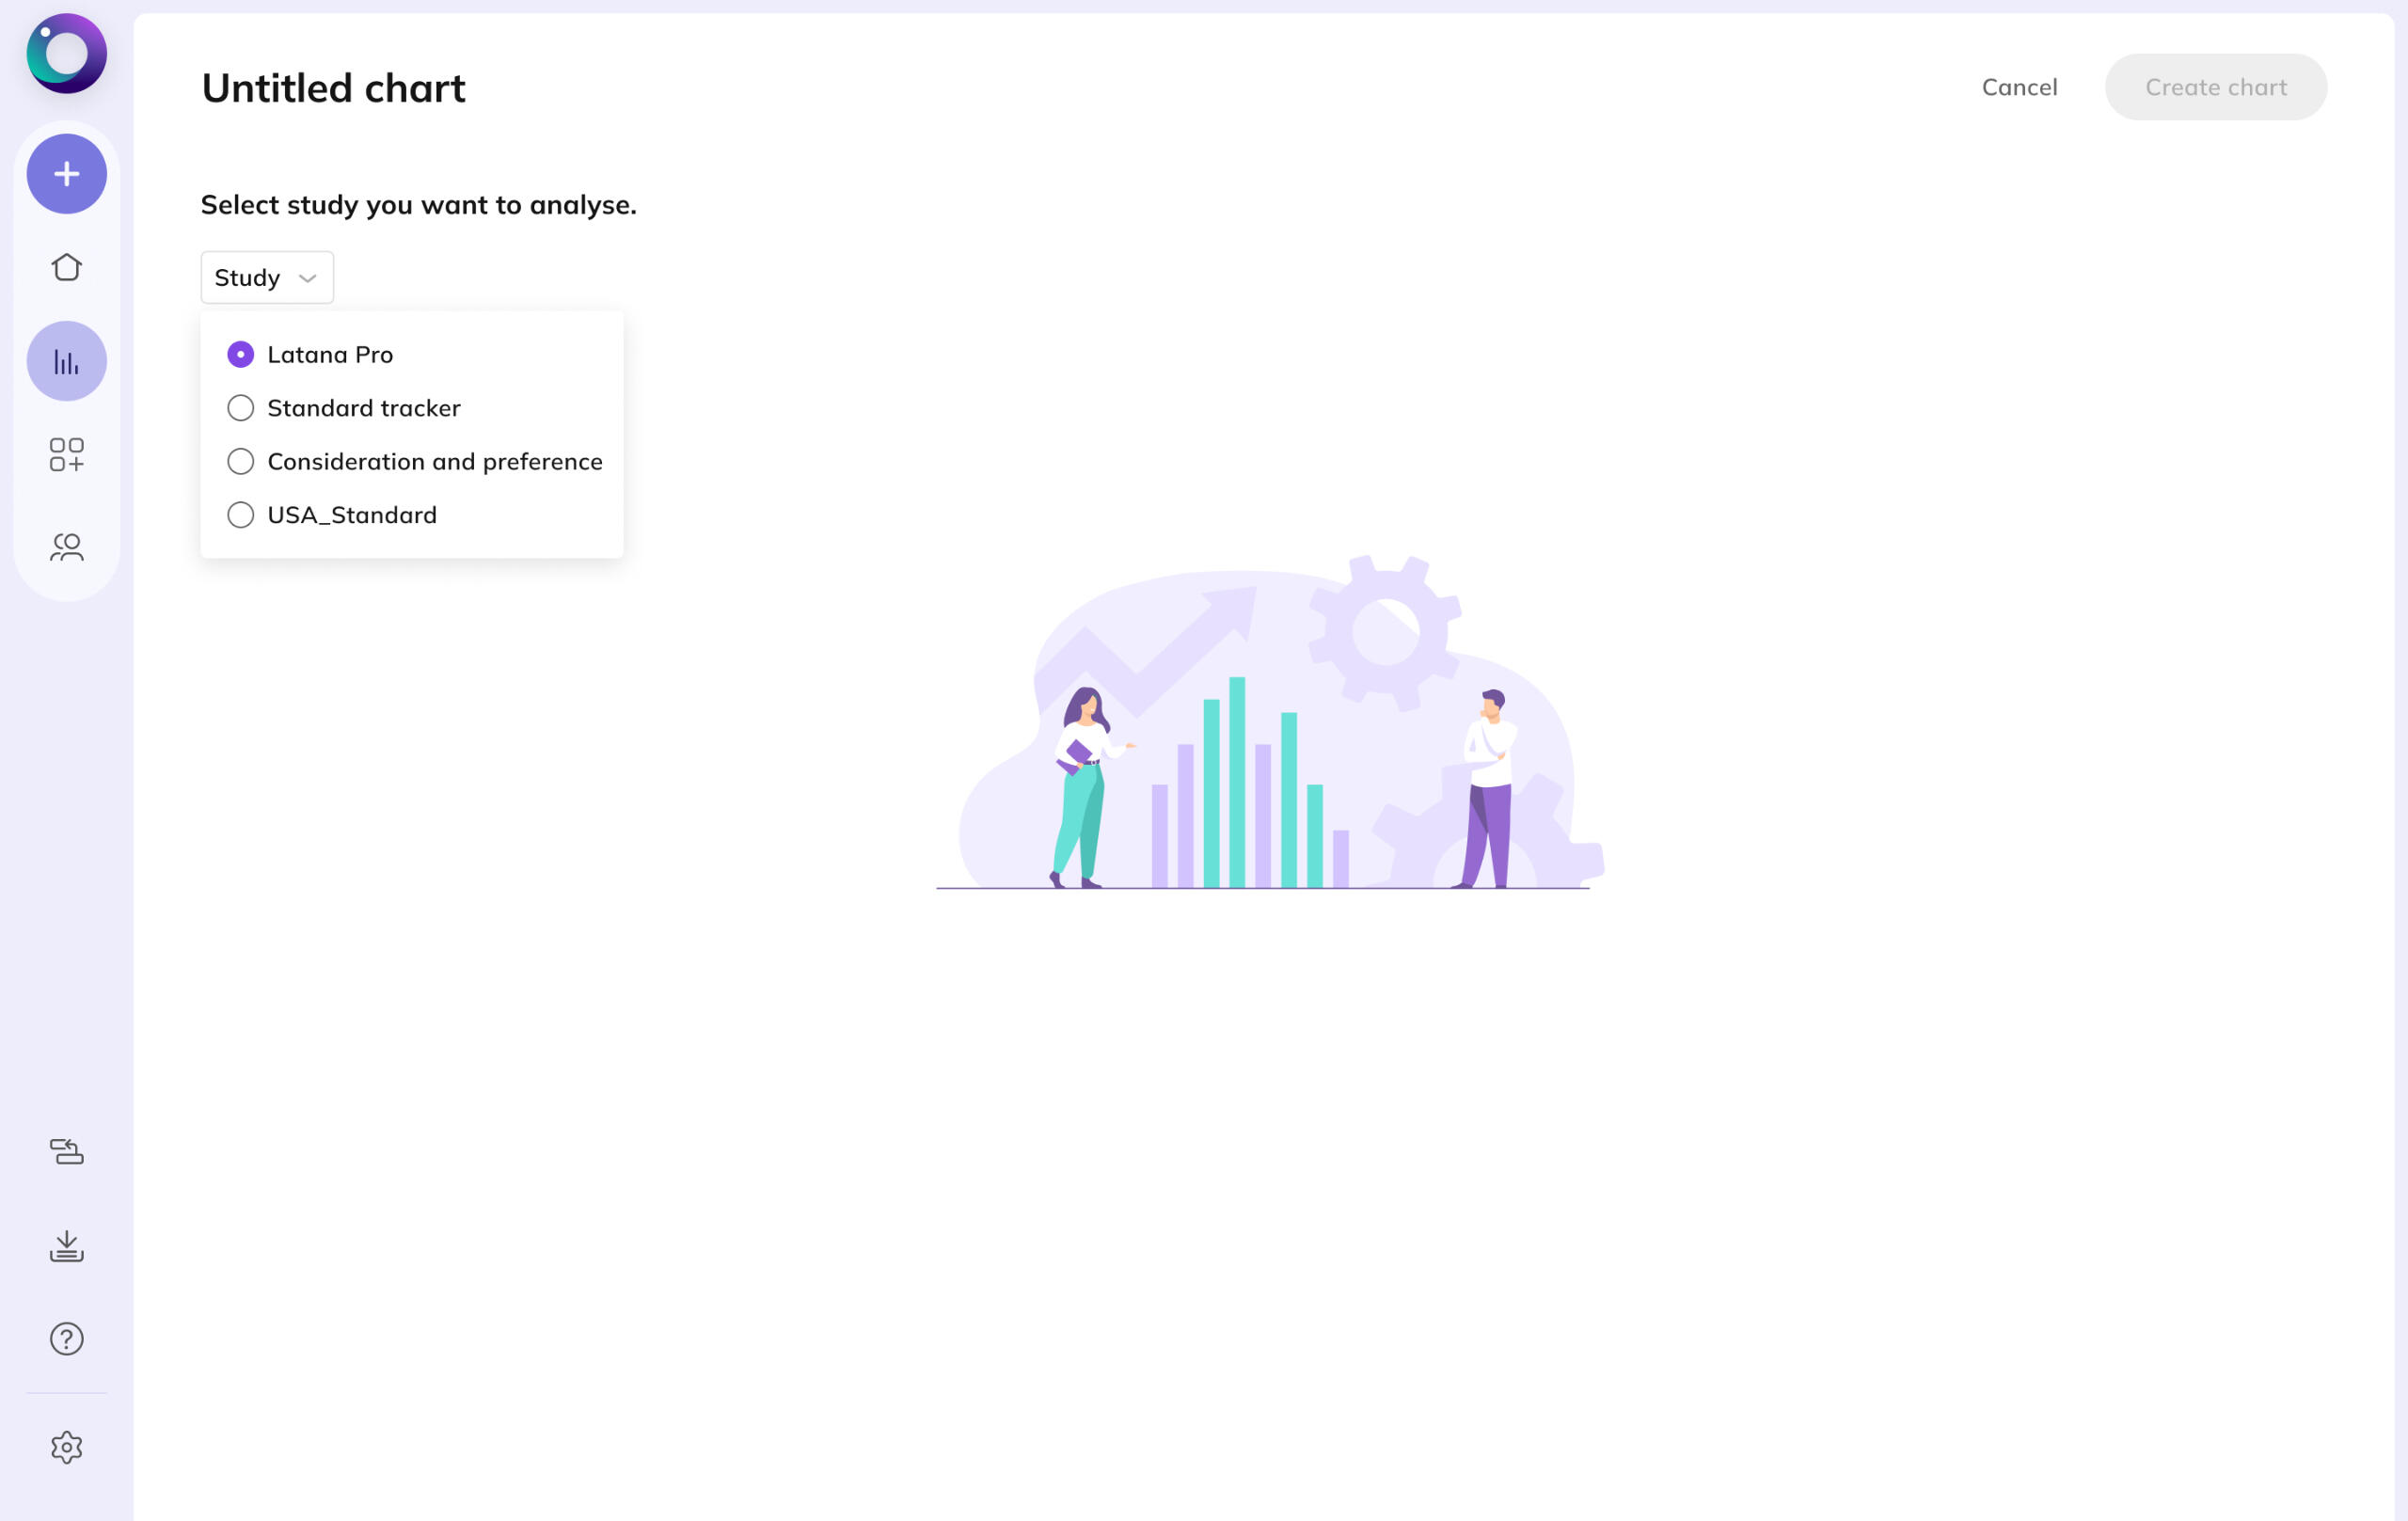
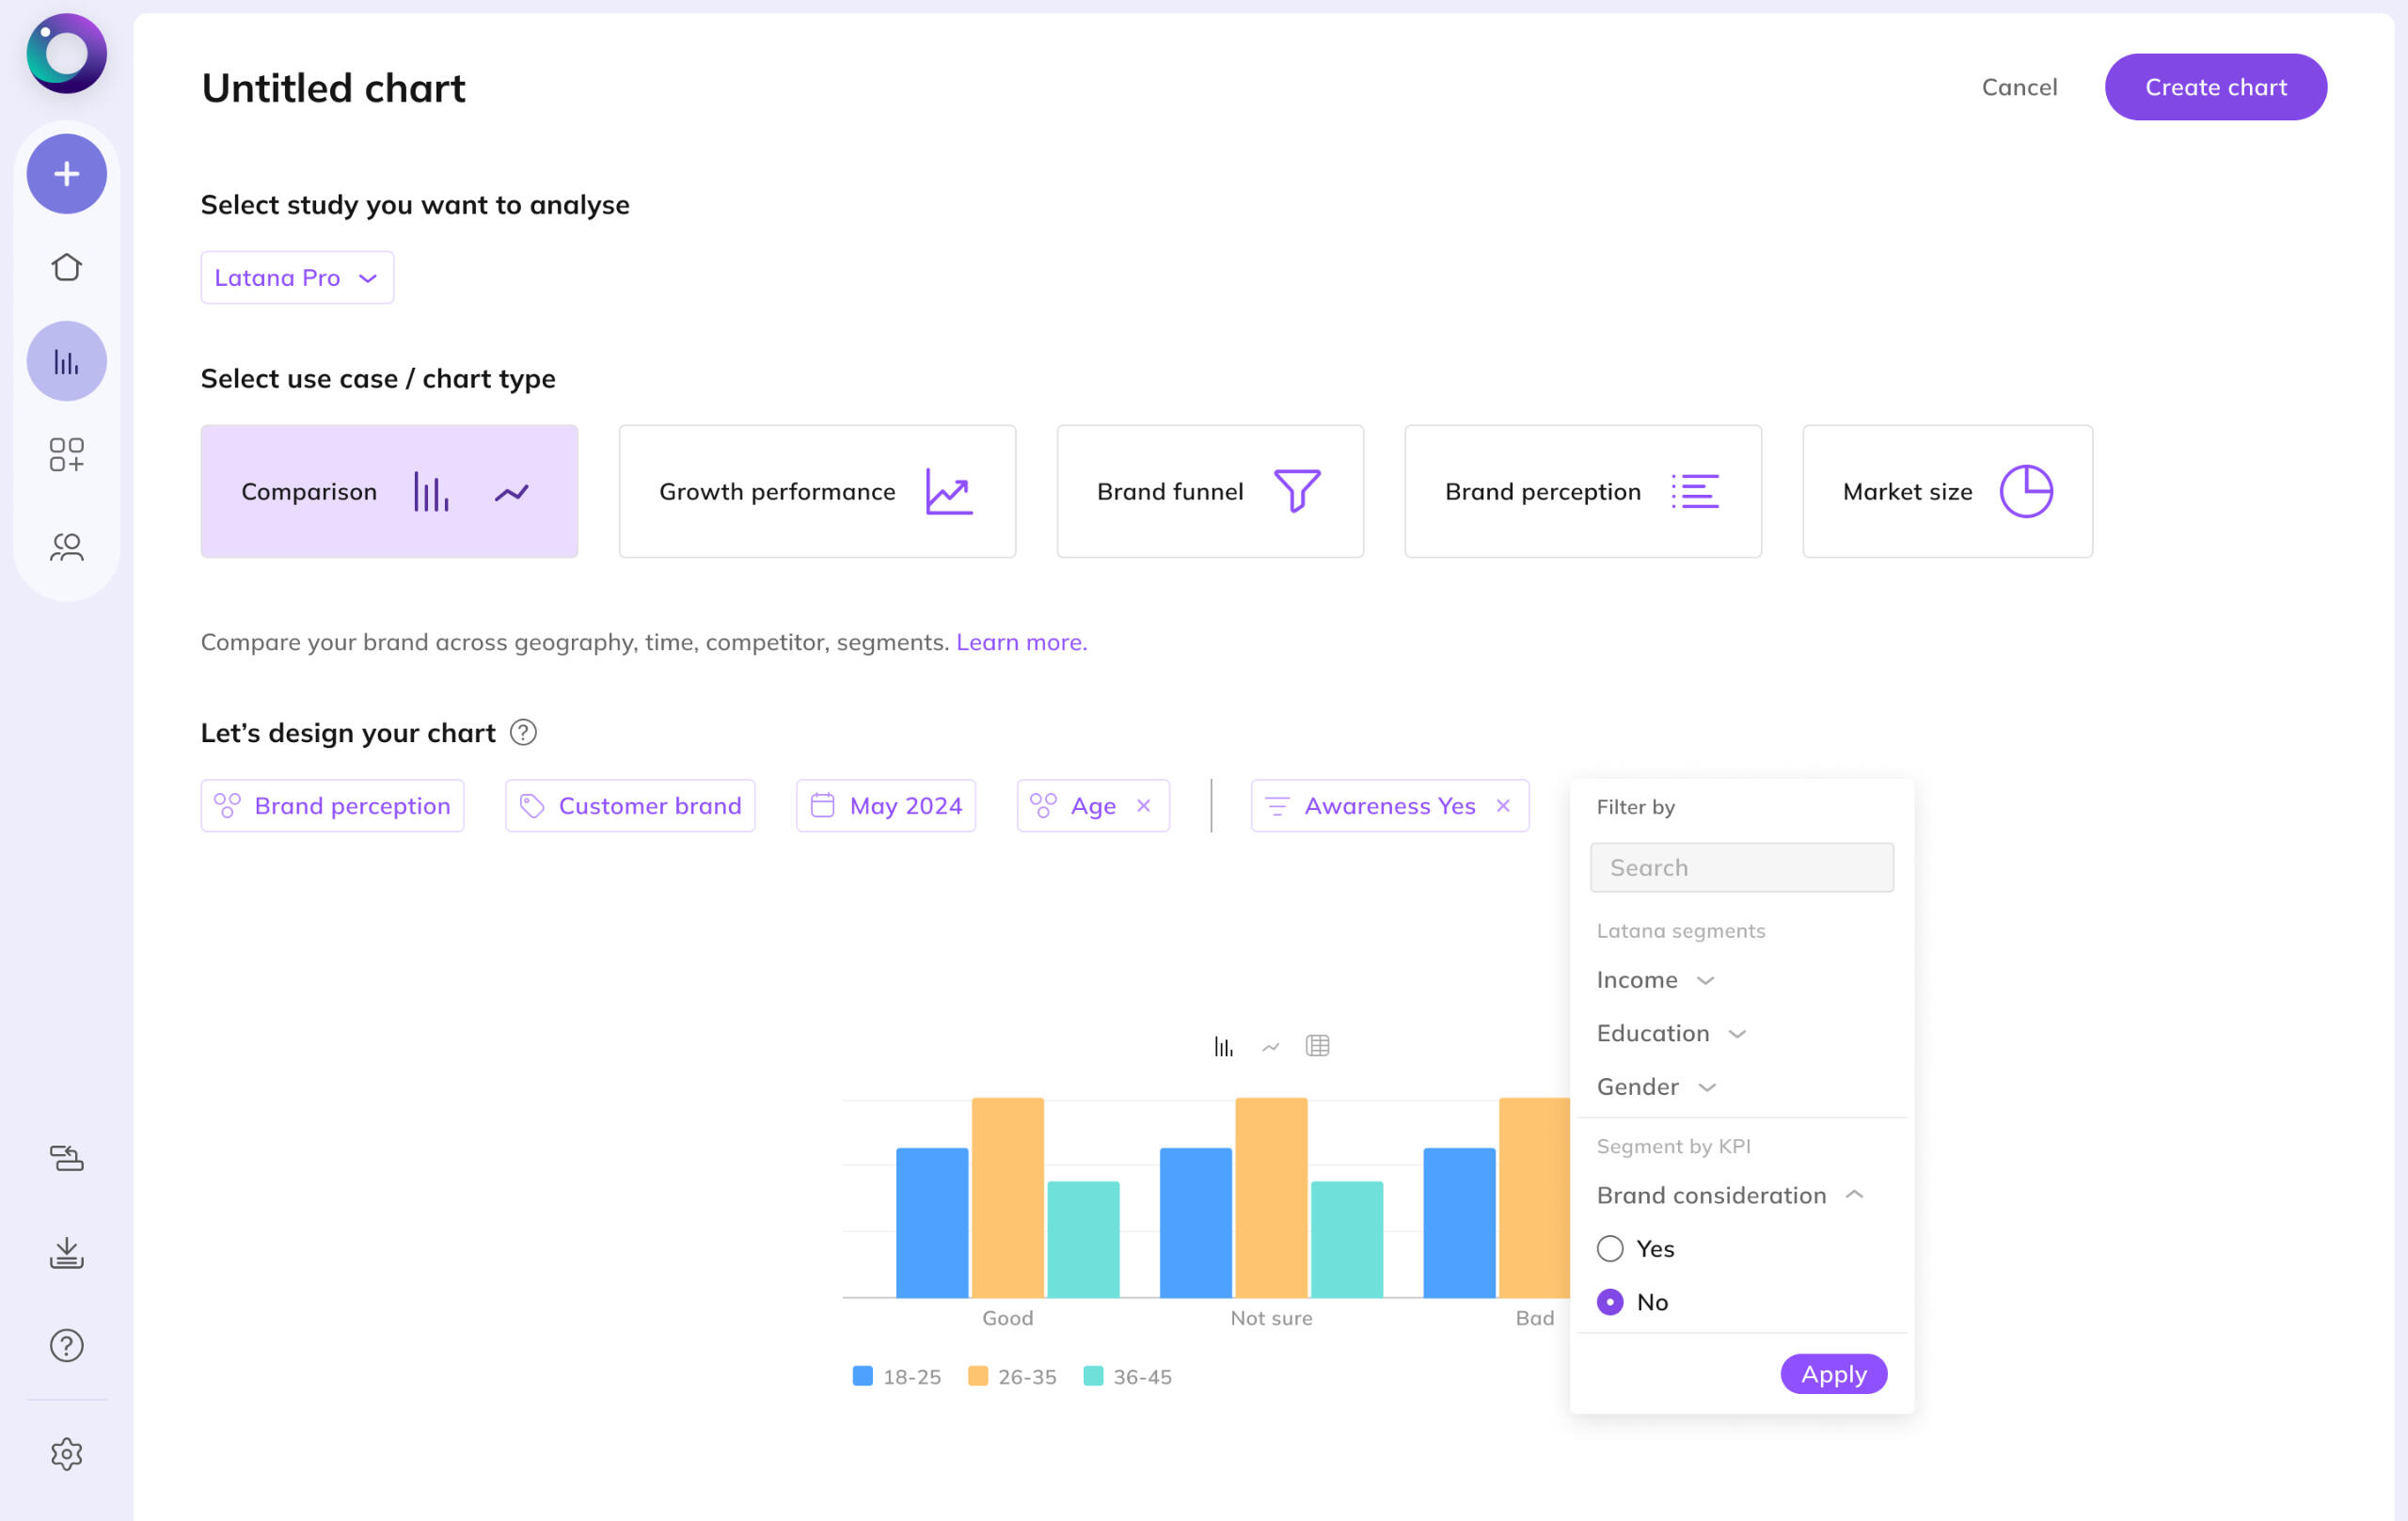
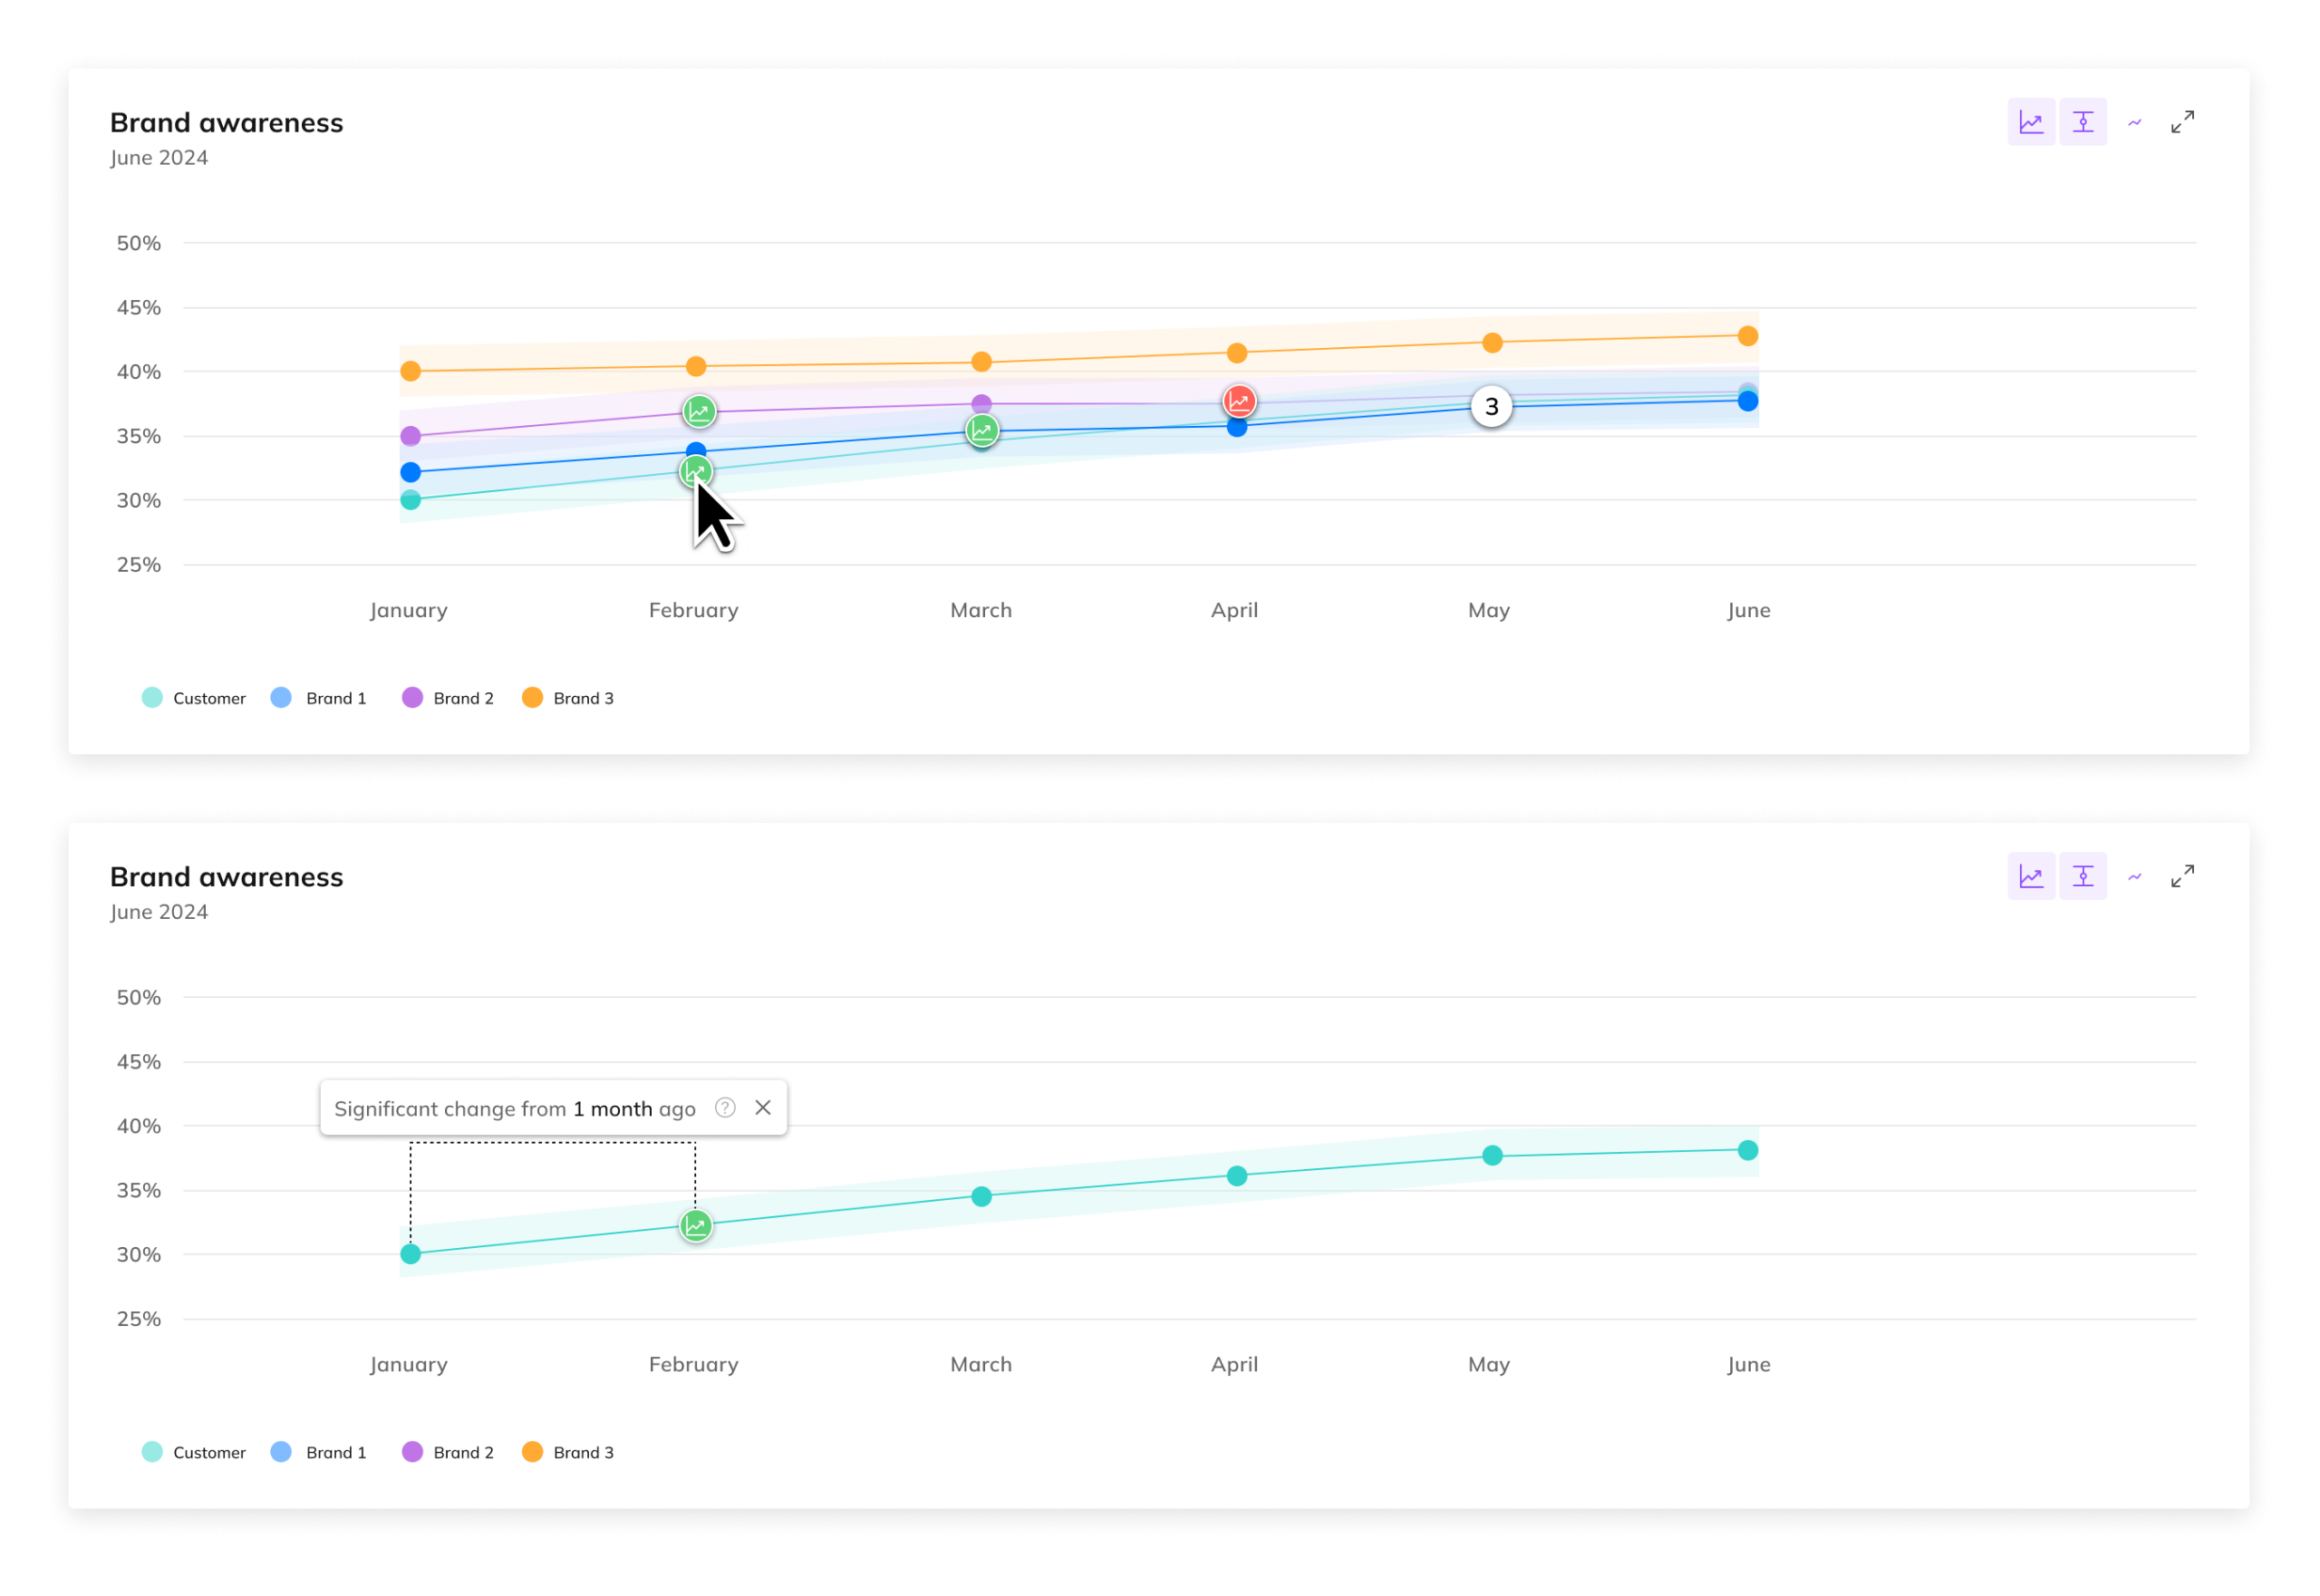
2. Self-Service Data Visualization Flow:
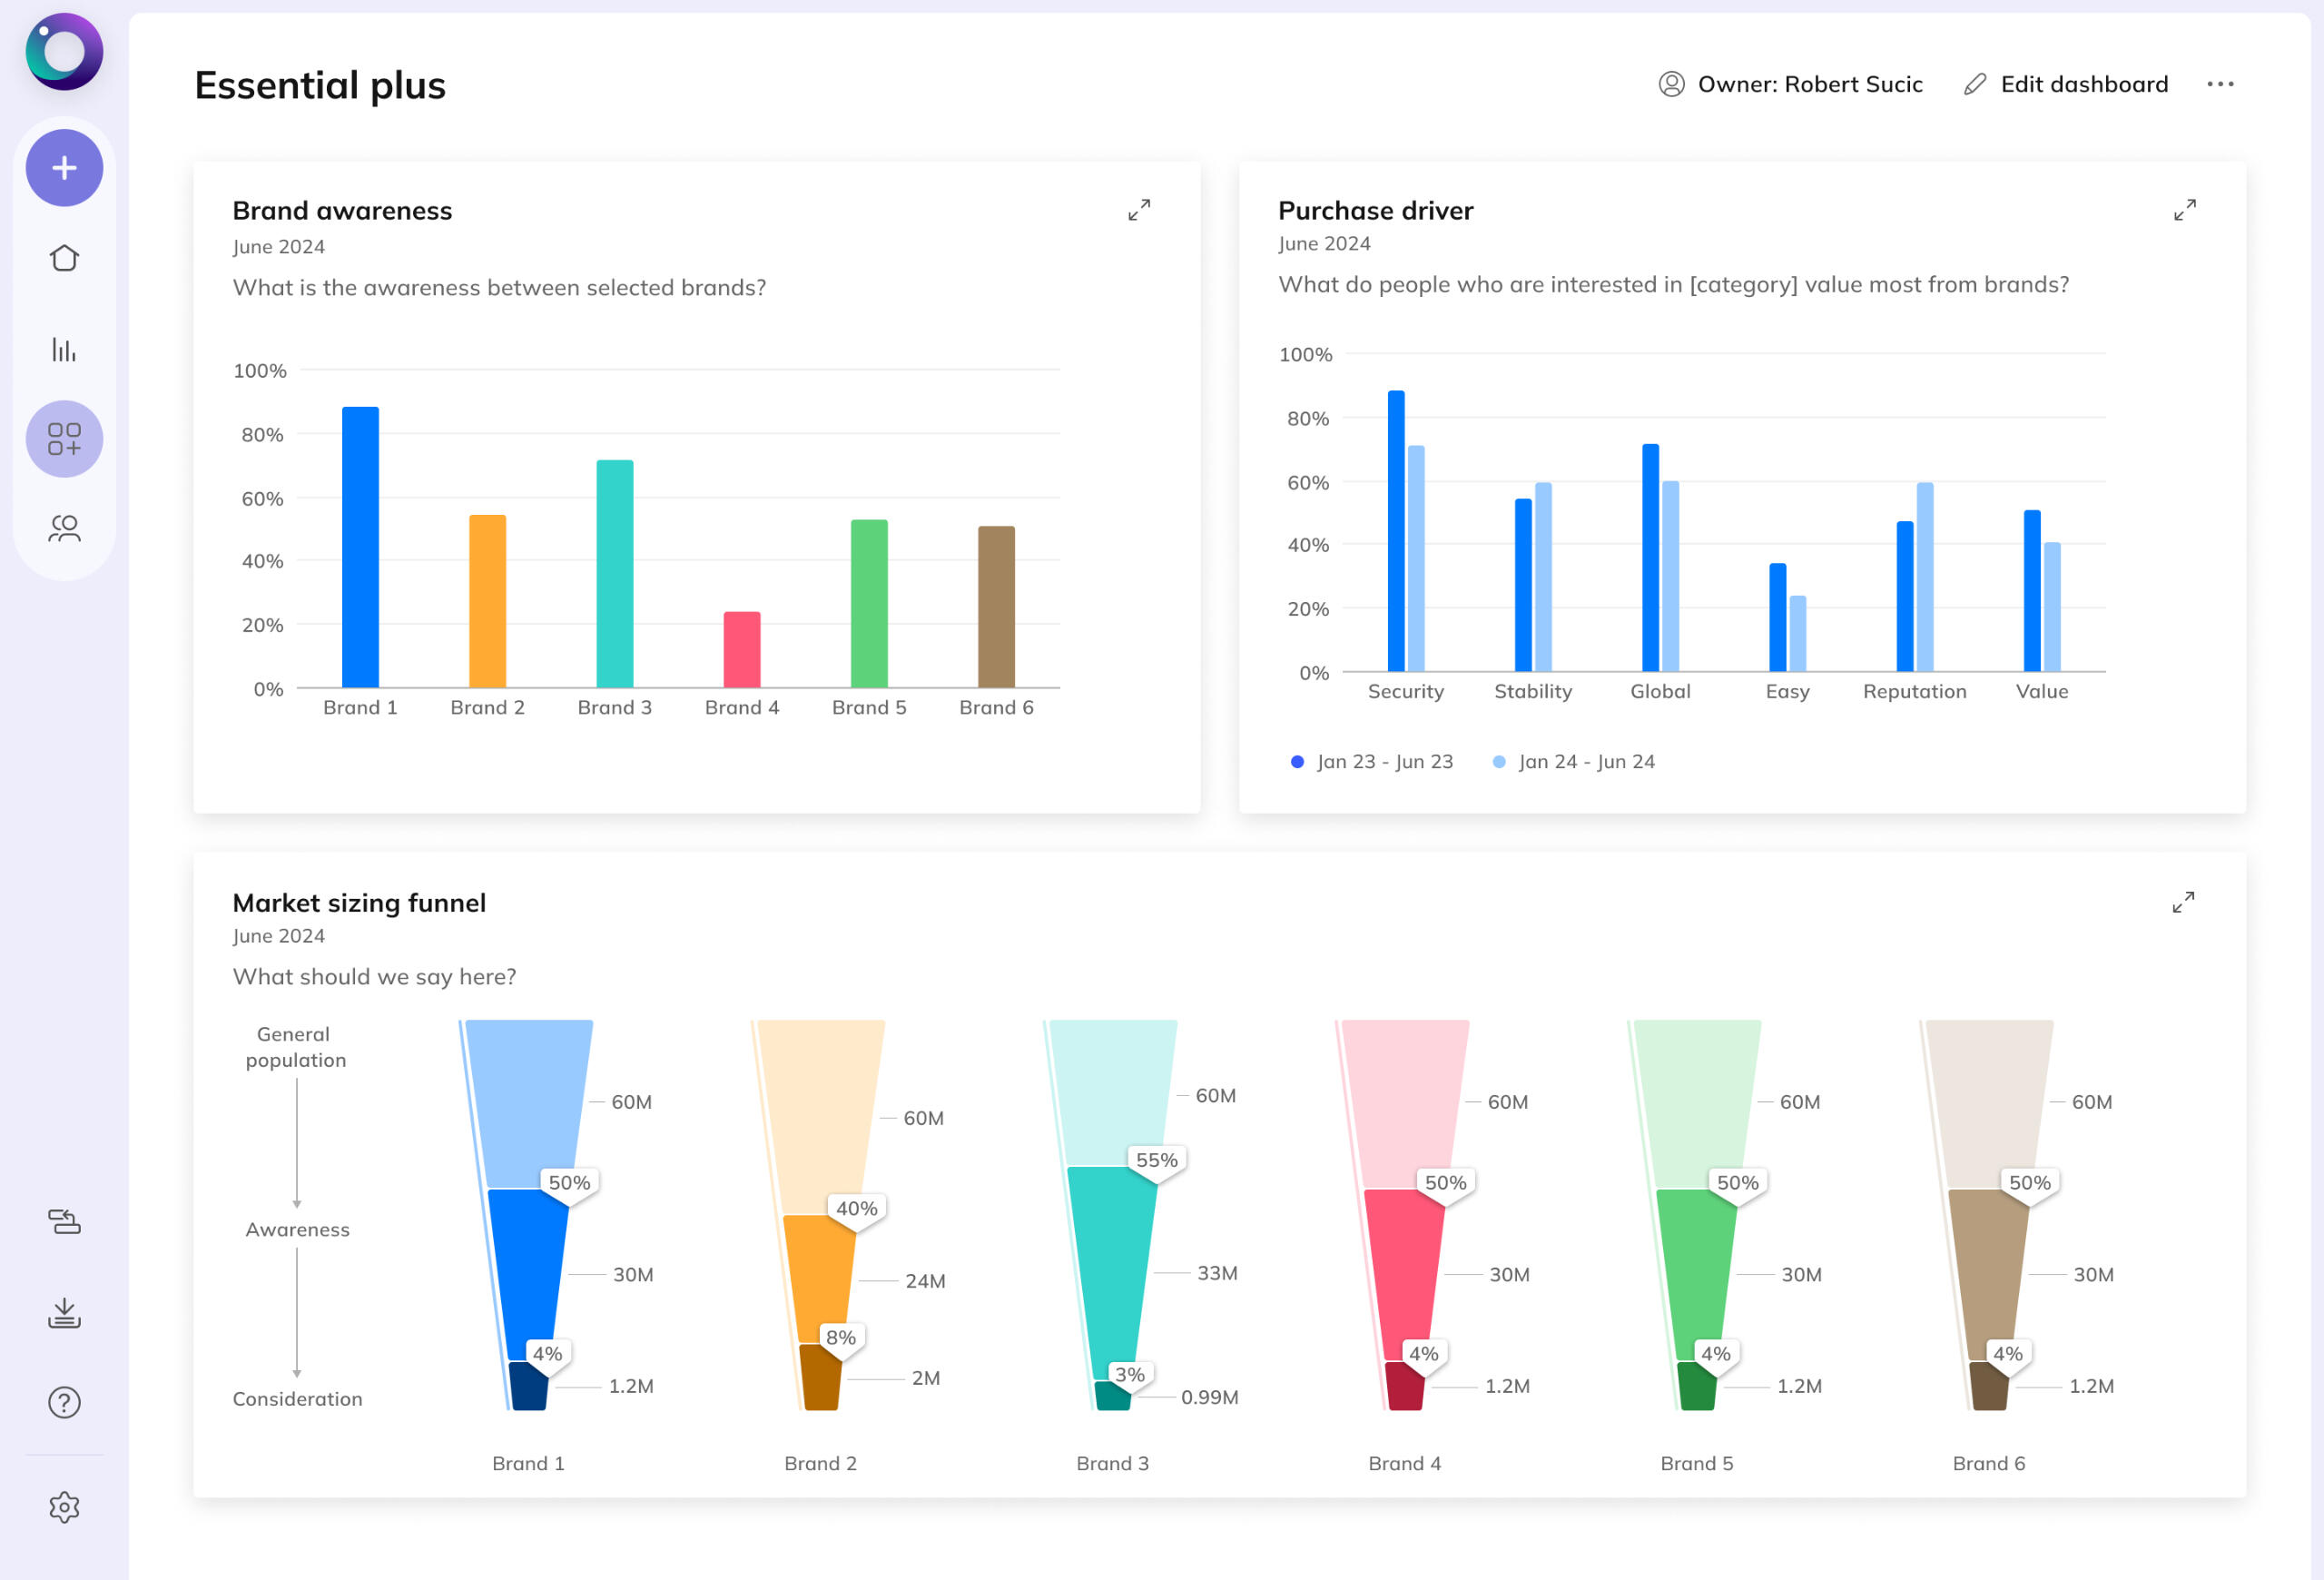
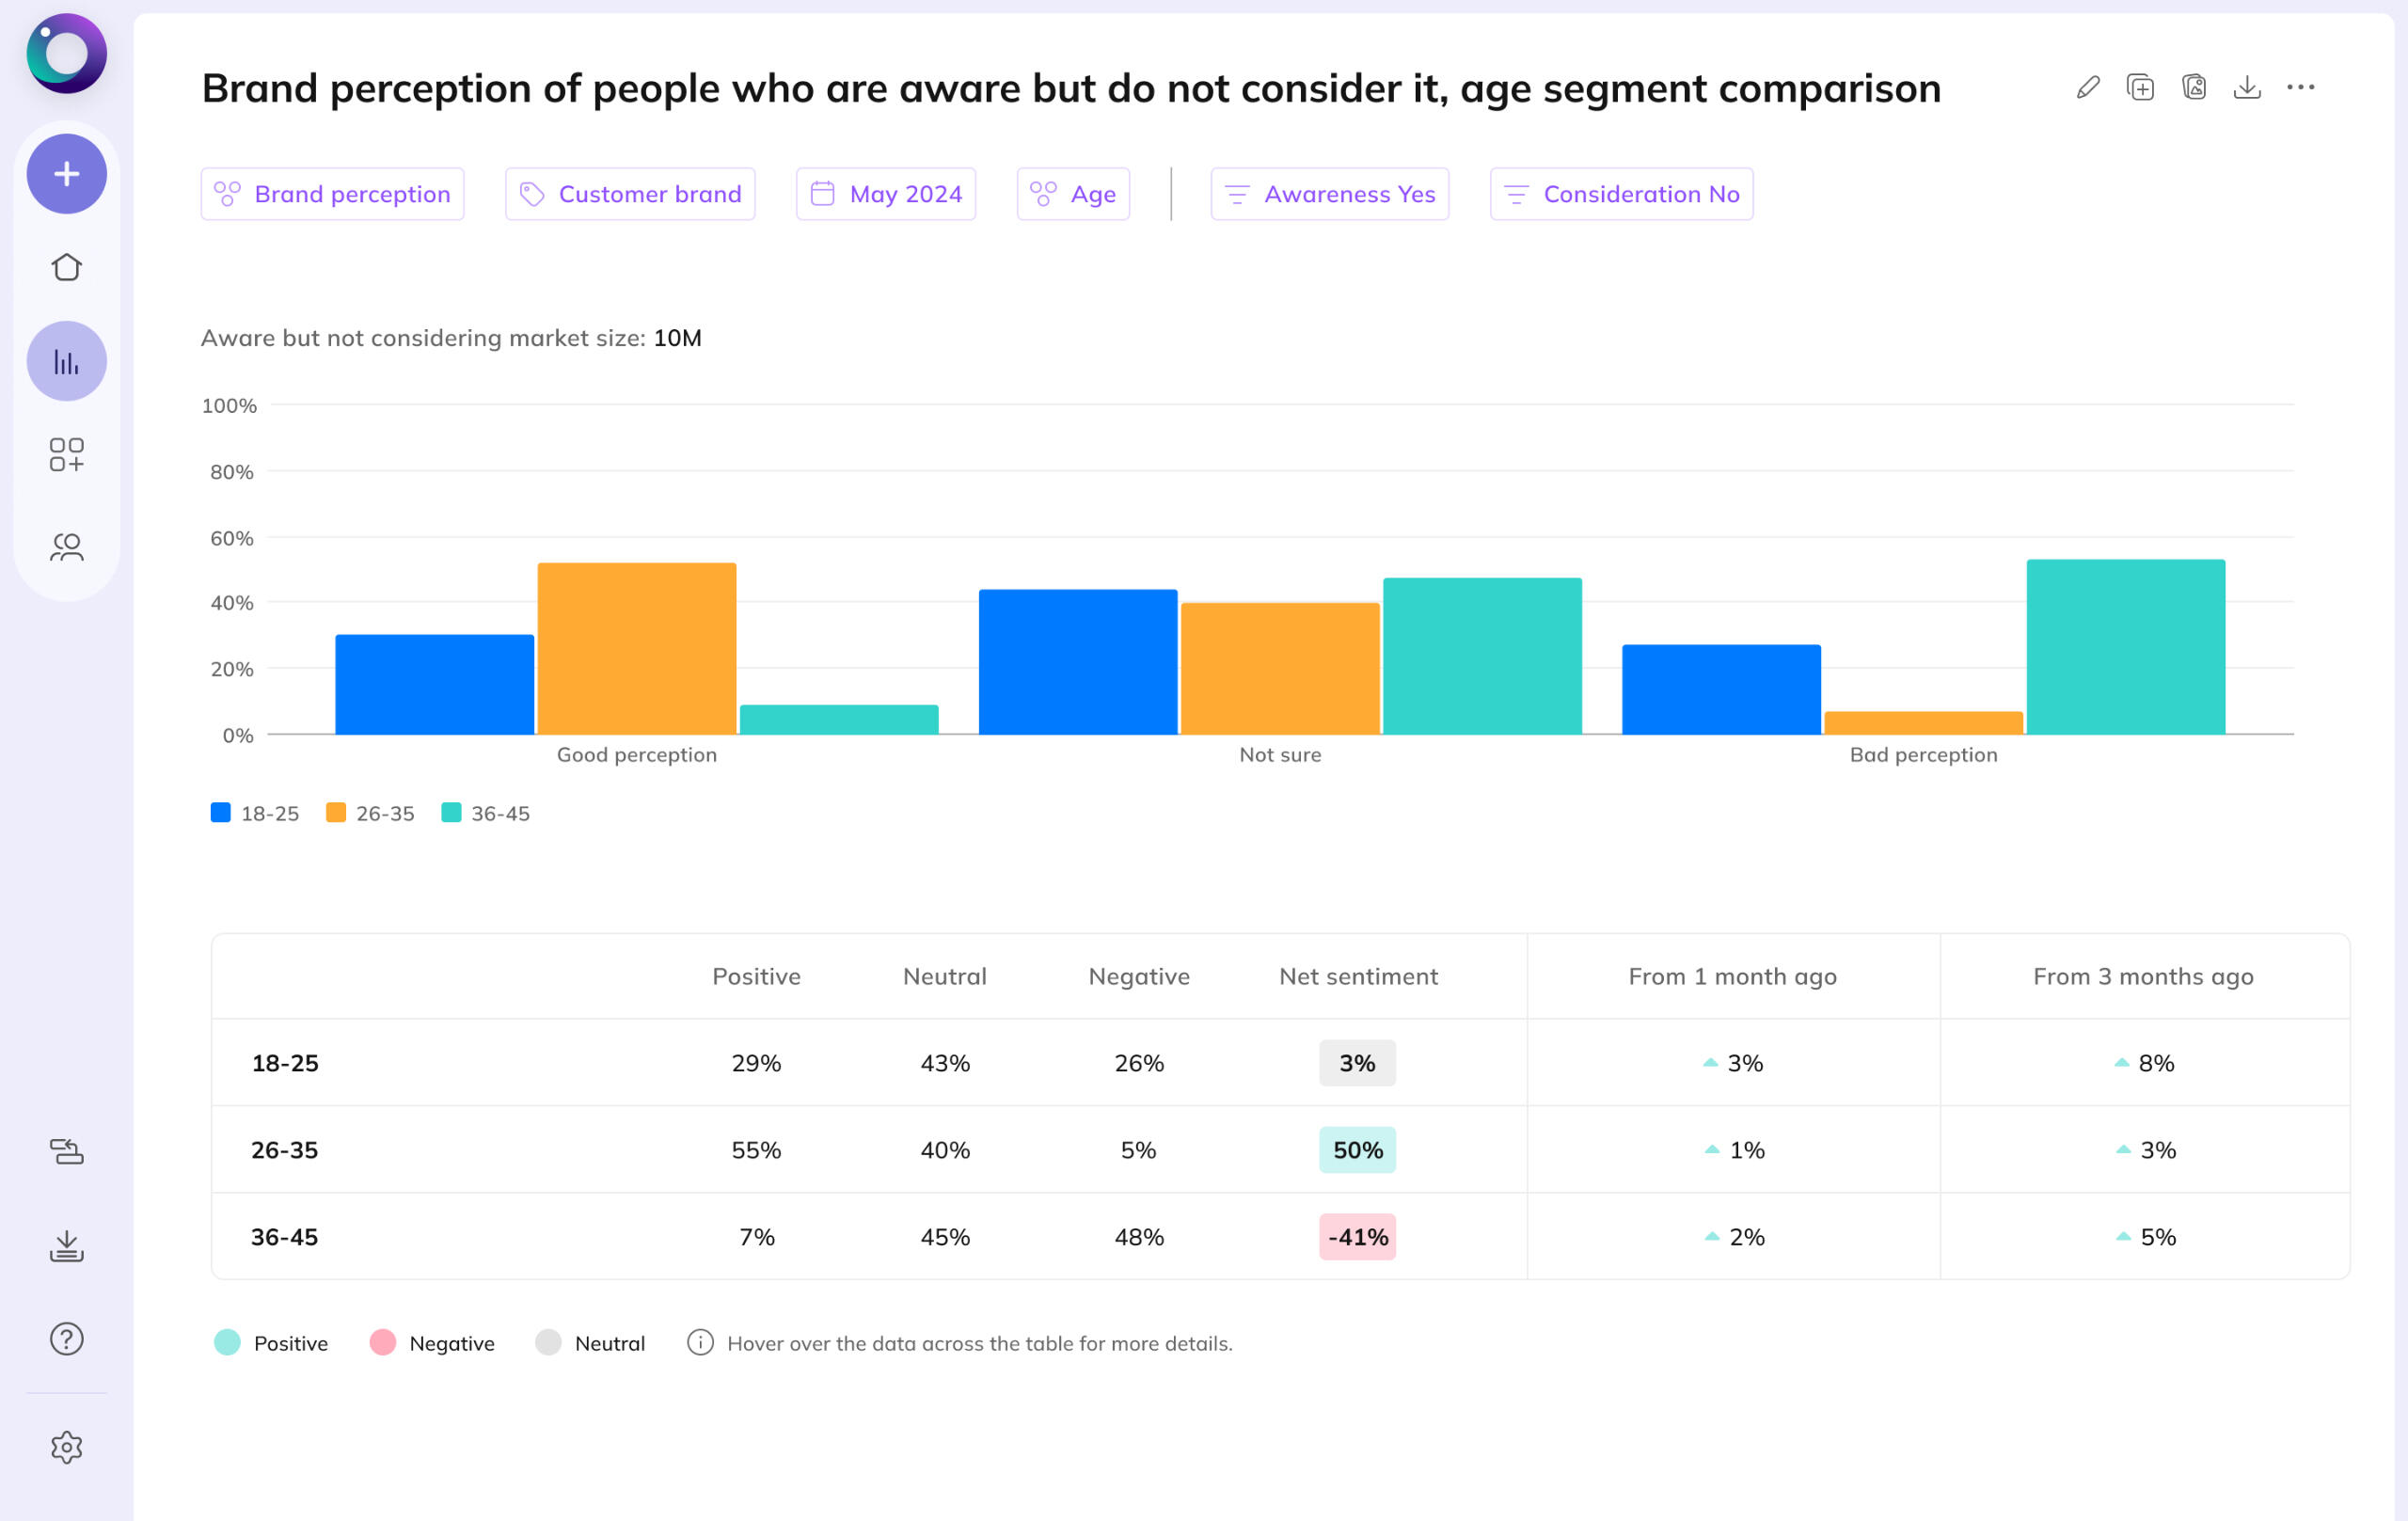
Enabled users to filter data by KPIs, segments, and time, unlocking critical insights.
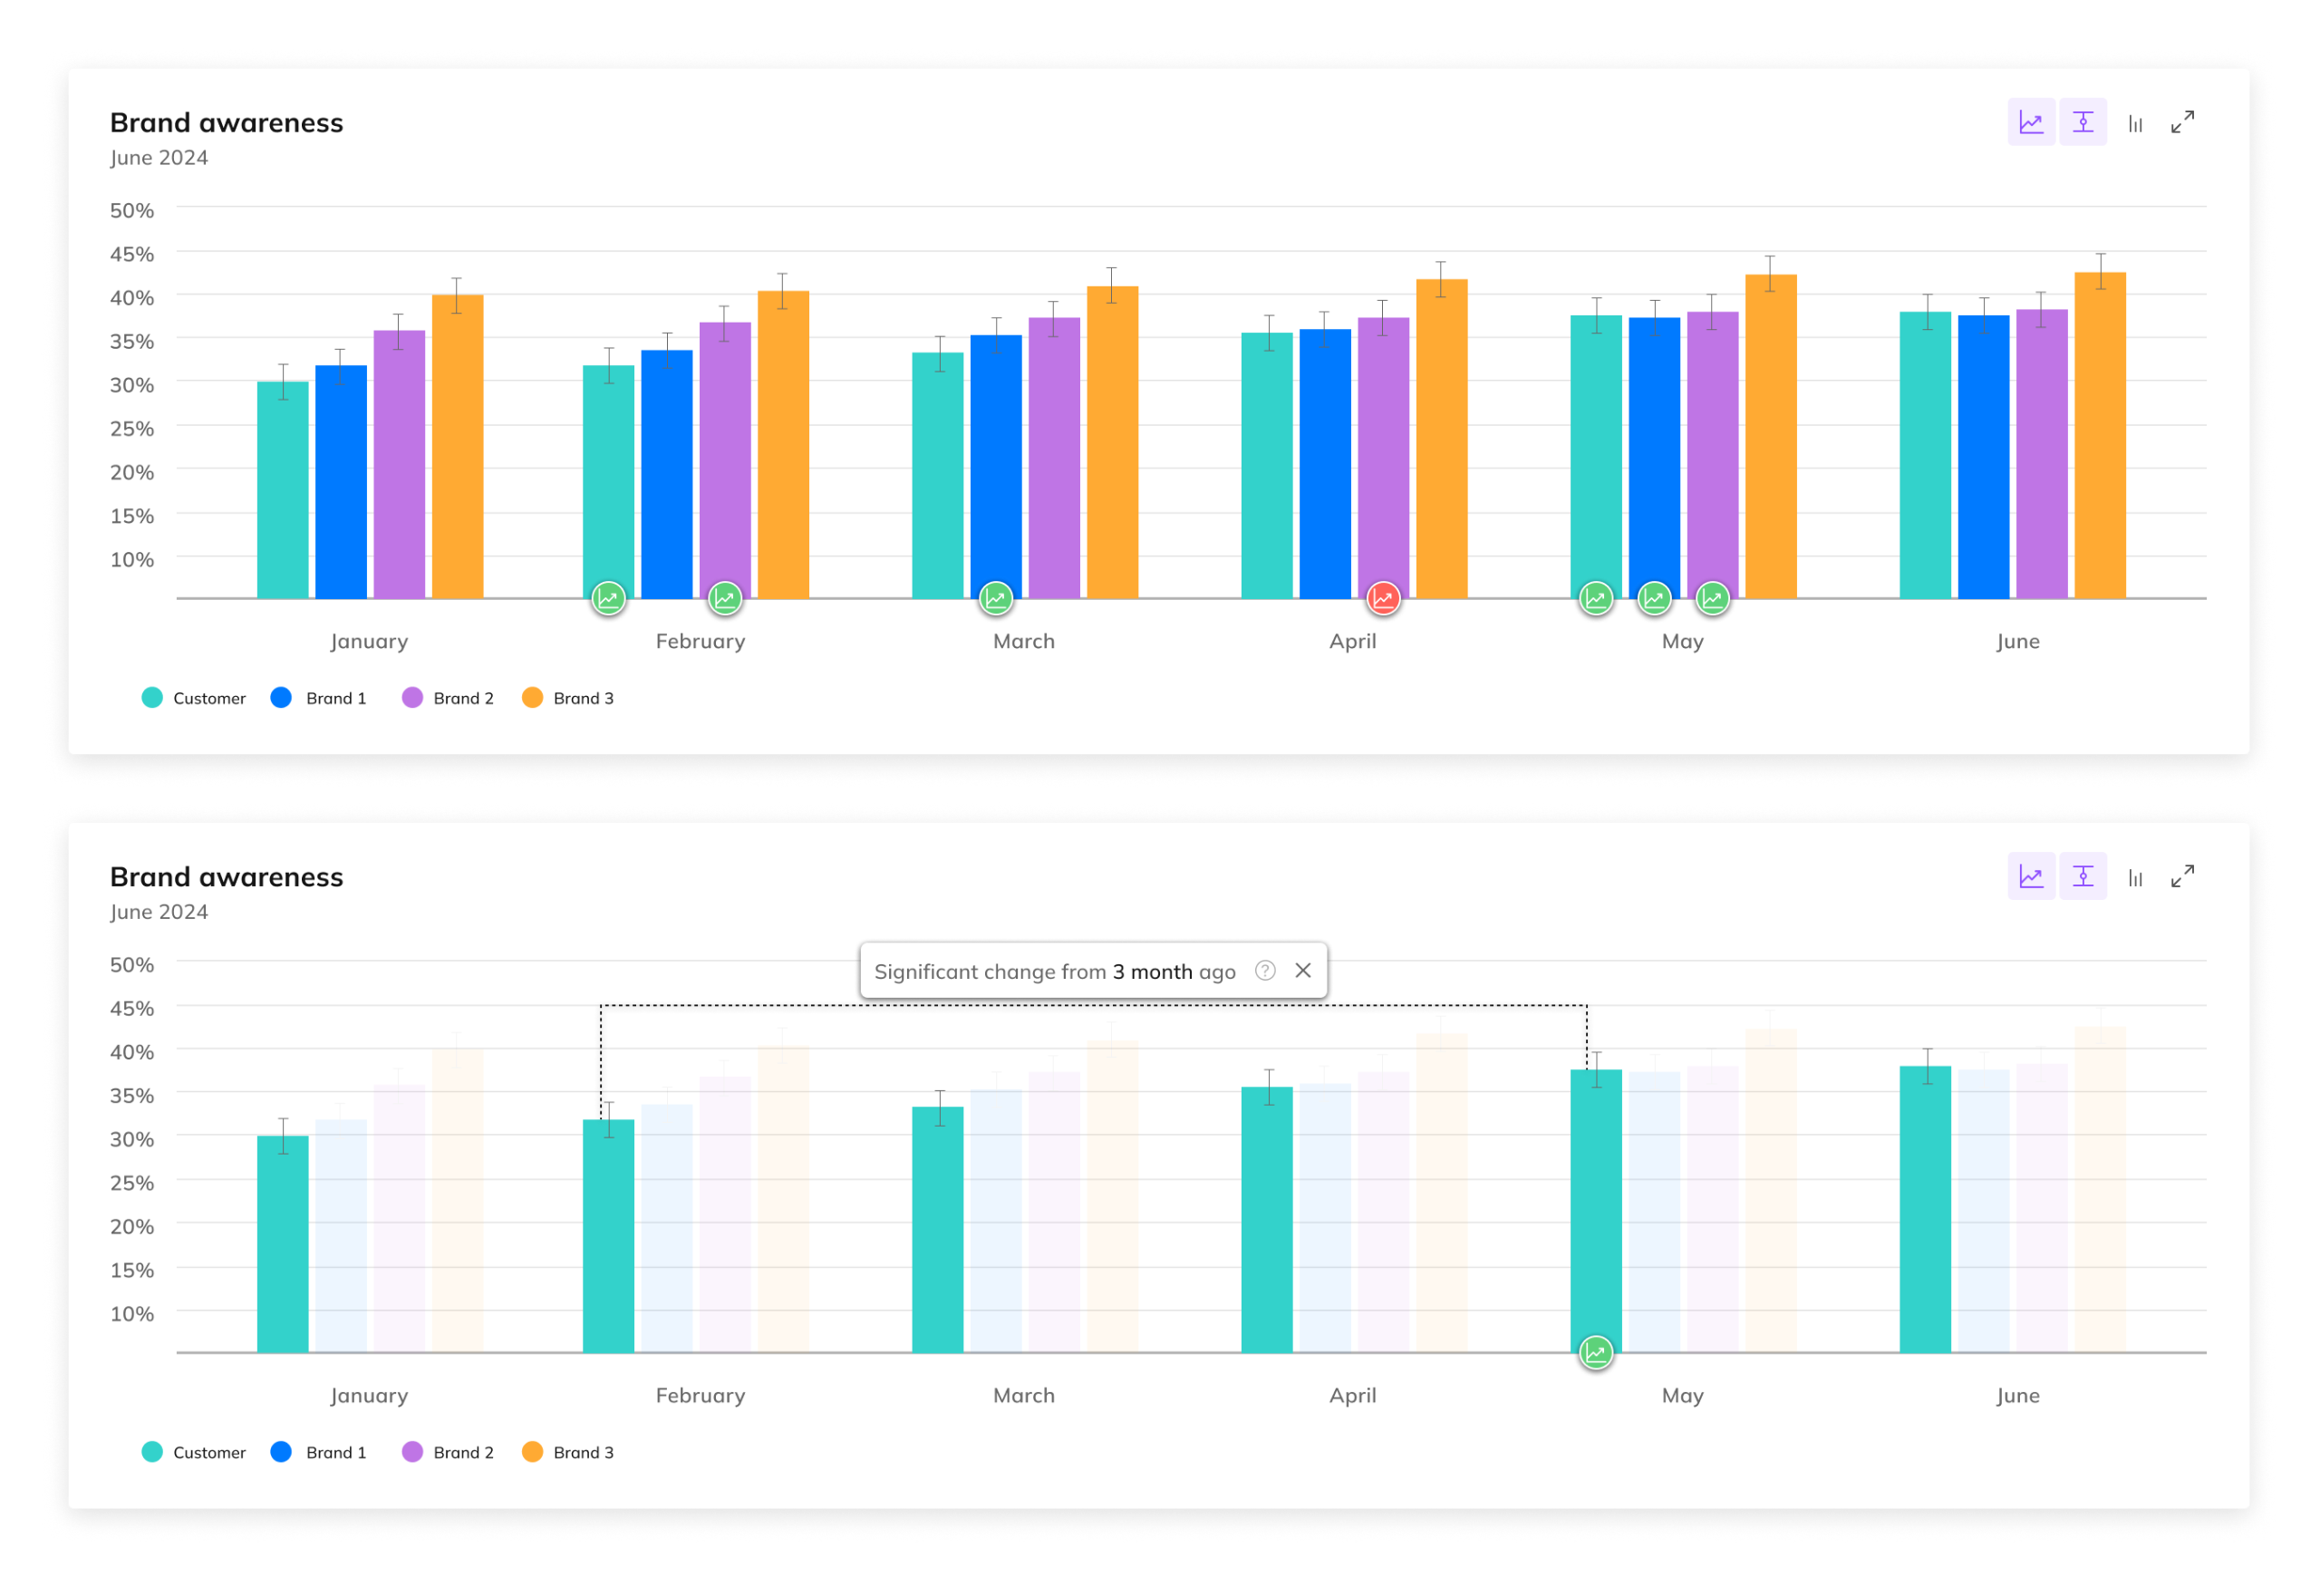
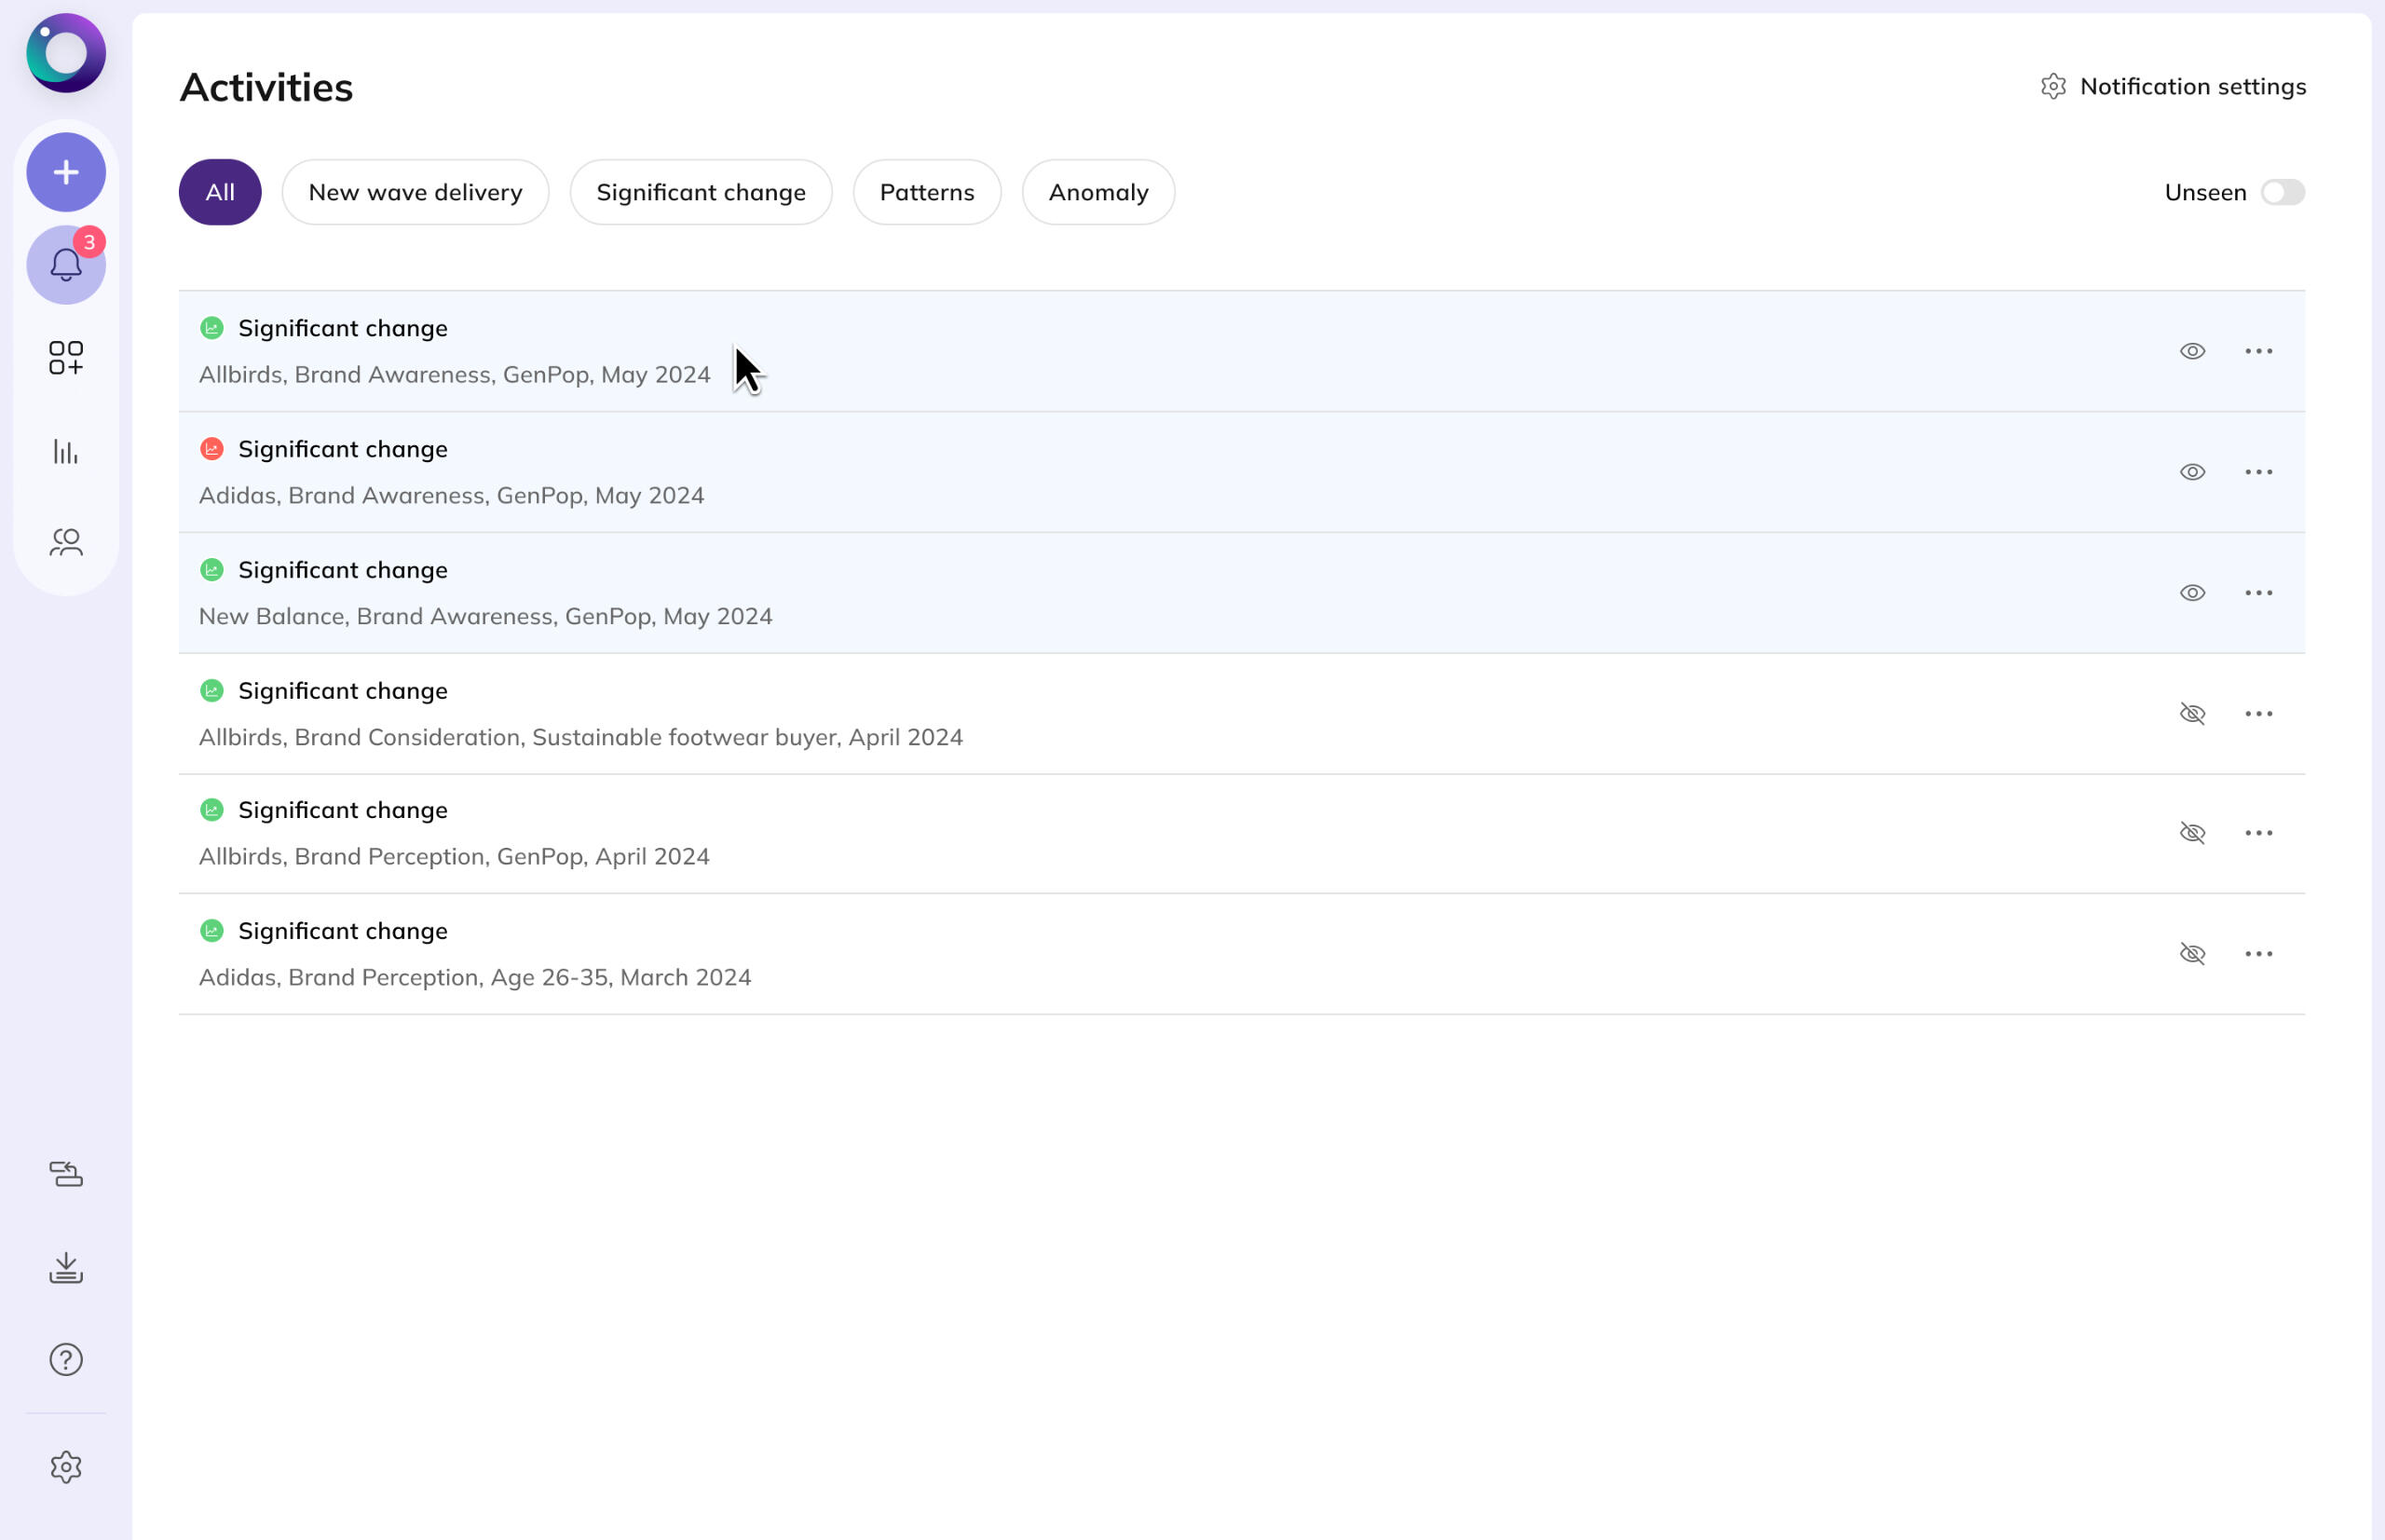
3. Statistical Significance Feature (Proof of Concept):
Conceptualized automated trend detection to reduce manual effort.
The Impact
👤 For Users
Real-Time Accuracy: Instant data analysis reduced manual effort and errors.
Deeper Insights: KPI and segment filters unlocked actionable brand performance insights.
🚀 For The Business
Higher Customer Value: 30% boost in subscriptions for expanded tracking.
Operational Efficiency: Eliminated manual data delivery, saving hundreds of hours annually.
Increased Engagement: Intuitive design enhanced user retention.
Stronger Sales: Interactive dashboards accelerated customer acquisition.